
Excel template cost volume profit analysis
Excel template cost-volume-profit analysis
This article provides details of Excel template cost-volume-profit analysis that you can download now.
L’analyste financier est externe à l’entreprise. Souvent, il ne dispose d'aucune information sur la structure des coûts analytiques pour pouvoir porter un jugement sur la rentabilité d'exploitation. L’analyse coût-volume-profit, en abrégé CVP, est une modélisation extrêmement simple qui vise à estimer, moyennant des hypothèses, le seuil de rentabilité d’exploitation de l’entreprise. Précisons tout de suite que cette analyse n’a pas un sens réel que pour une entreprise de petite taille ou de taille moyenne qui ne fabrique qu’une famille de produits dérivés d’un même processus de production.
Microsoft Excel software under a Windows environment is required to use this template
These Excel template cost-volume-profit analysis work on all versions of Excel since 2007.
Examples of a ready-to-use spreadsheet: Download this table in Excel (.xls) format, and complete it with your specific information.
To be able to use these models correctly, you must first activate the macros at startup.
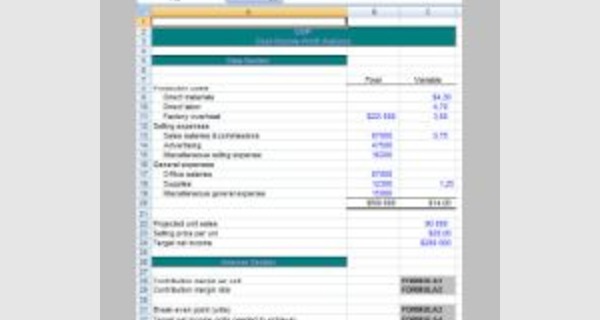
The file to download presents tow Excel template cost-volume-profit analysis
These CVP analysis templates helps you perform a break-even analysis, calculate the margin of safety and find the degree of operating leverage.
Cost-Volume-Profit Analysis
Managers are concerned about the impact of their decisions on profit. The decisions they make are about volume, pricing, or incurring a cost. Therefore, managers require an understanding of the relations among revenues, costs, volume, and profit. Cost-volume-profit (CVP) analysis is a technique that examines changes in profits in response to changes in sales volumes, costs, and prices. The cost accounting department supplies the data and analysis, that support these manager. Estimate future revenues, costs, and profits to help them plan and monitor operations. They use cost-volume-profit (C.V.P) analysis to identify the levels of operating activity needed to avoid losses, achieve targeted profits, plan future operations, and monitor organizational performance. Managers also analyze operational risk as they choose an appropriate cost structure.
Cost-volume-profit (CVP) analysis :
is a method for analyzing how operating decisions and marketing decisions affect profit based on an understanding of the relationship between variable costs, fixed costs, unit selling price, and how they change in a predictable way as the volume of activity changes(the output level), CVP analysis has many applications:
- Setting prices for products and services.
- Introducing a new product or service.
- Replacing a piece of equipment.
- Determining the breakeven point.
- Deciding whether to make or buy a given product or service.
- Determining the best product mix.
- Performing strategic what-if analyses.
Cost-Volume-Profit Analysis Assumptions
- Changes in production/sales volume are the sole cause for cost and revenue changes
- Total costs consist of fixed costs and variable costs
- Revenue and costs behave and can be graphed as a linear function (a straight line) .
- Selling price, variable cost per unit, and fixed costs are all known and constant
- In many cases only a single product will be analyzed. If multiple products are studied, their relative sales proportions are known and constant
- The time value of money (interest) is ignored
Strategic Questions Answered by CVP Analysis:
- What is the expected level of profit at a given sales volume?
- What additional amount of sales is needed to achieve a desired level of profit?
- What will be the effect on profit of a given increase in sales?
- What is the required funding level for a governmental agency, given desired service levels?
- Is the forecast for sales consistent with forecasted profits?
- What additional profit would be obtained from a given percentage reduction in unit variable costs?
- What increase in sales is needed to make up a given decrease in price to maintain the present profit level?
- What sales level is needed to cover all costs in a sales region or product line?
- What is the required amount of increase in sales to meet the additional fixed charges from a proposed plant expansion? Prof.Dr. Hayder Ali al-masudi
CVP analysis begins with the basic profit equation.
Profit =Total revenue - Total costs
Separating costs into variable and fixed categories, we express profit as:
Profit = Total revenue -(Total variable costs +Total fixed costs)
We use the profit equation to plan for different volumes of operations.
CVP analysis can be performed using either:
- Units (quantity) of product sold
- Revenues (in dollars)
Contribution Margin :
Contribution margin per unit tells us how much revenue from each unit sold can be applied toward fixed costs it is:
- M= P-V
contribution margin ratio (CMR) is the percent by which the selling price (or revenue) per unit exceeds the variable cost per unit, or contribution margin as a percent of revenue, it is
Prof.Dr. Hayder Ali al-masudi
7
C.V.P Analysis applications:
- The Break-Even Point:
The break-even point is the point in the volume of activity where the organization’s revenues and expenses are equal.
Revenue= total cost
SP × Q = (V × Q) + F
(SP×Q) - (V×Q)=F
Q (SP-V) = F
- Margin of Safety:
The Margin of Safety is the difference between the expected level of sales and breakeven sales.
It may be expressed in units or dollars of sales.
- Margin of safety in units = Actual(estimated) units of activity -Units at breakeven point
- Margin of safety in revenues = Actual(estimated)revenue - Revenue at breakeven point
- The MOS Ratio removes the firm’s size from the output, and expresses itself in the form of
a percentage
CVP Analysis application;
- Target Net Profit
CVP analysis can be used to determine the level of sales needed to achieve a desired level of profit. Finding the desired profit involves:
- revenue planning: determine the revenue required to achieve a desired profit level.
- cost planning: find the value of the required variable cost or fixed cost to achieve the desired profit at the assumed sales quantity.
- accounting for the effect of income taxes.
We can determine the number of Unites that X must sell to earn a profit of $100,000 using the contribution margin approach.